
The short version
- Net worth is assets minus debts. It is not Ready to Budget or permission to spend your account balances.
- Use the chart to see the trend, then the monthly table to understand changes in assets and debts.
- The totals, chart, and CSV describe the same selected accounts. Check the period and filters before comparing them.
What net worth actually is
Net worth is everything you own minus everything you owe. Cash, investments, and other assets contribute to what you own. Credit cards, loans, and other liabilities contribute to what you owe.
Own a car worth $10,000 but owe $4,000 on the loan? That car contributes $6,000 to your net worth. Have $20,000 in checking and $25,000 in credit card debt? You're net negative $5,000 in cash terms.
How ReadyCents calculates it
Every account you create has a type (checking, savings, credit, loan, asset, liability, etc.). ReadyCents adds assets such as cash, savings, investments, and property, then subtracts debts such as credit cards, loans, and mortgages. The difference is your net worth.
Off-budget accounts can still count toward net worth. A retirement account can be included in this report without supplying cash to your monthly budget. The Accounts and Account type filters let you narrow the report, so always check which accounts are included.
Example: see the whole picture
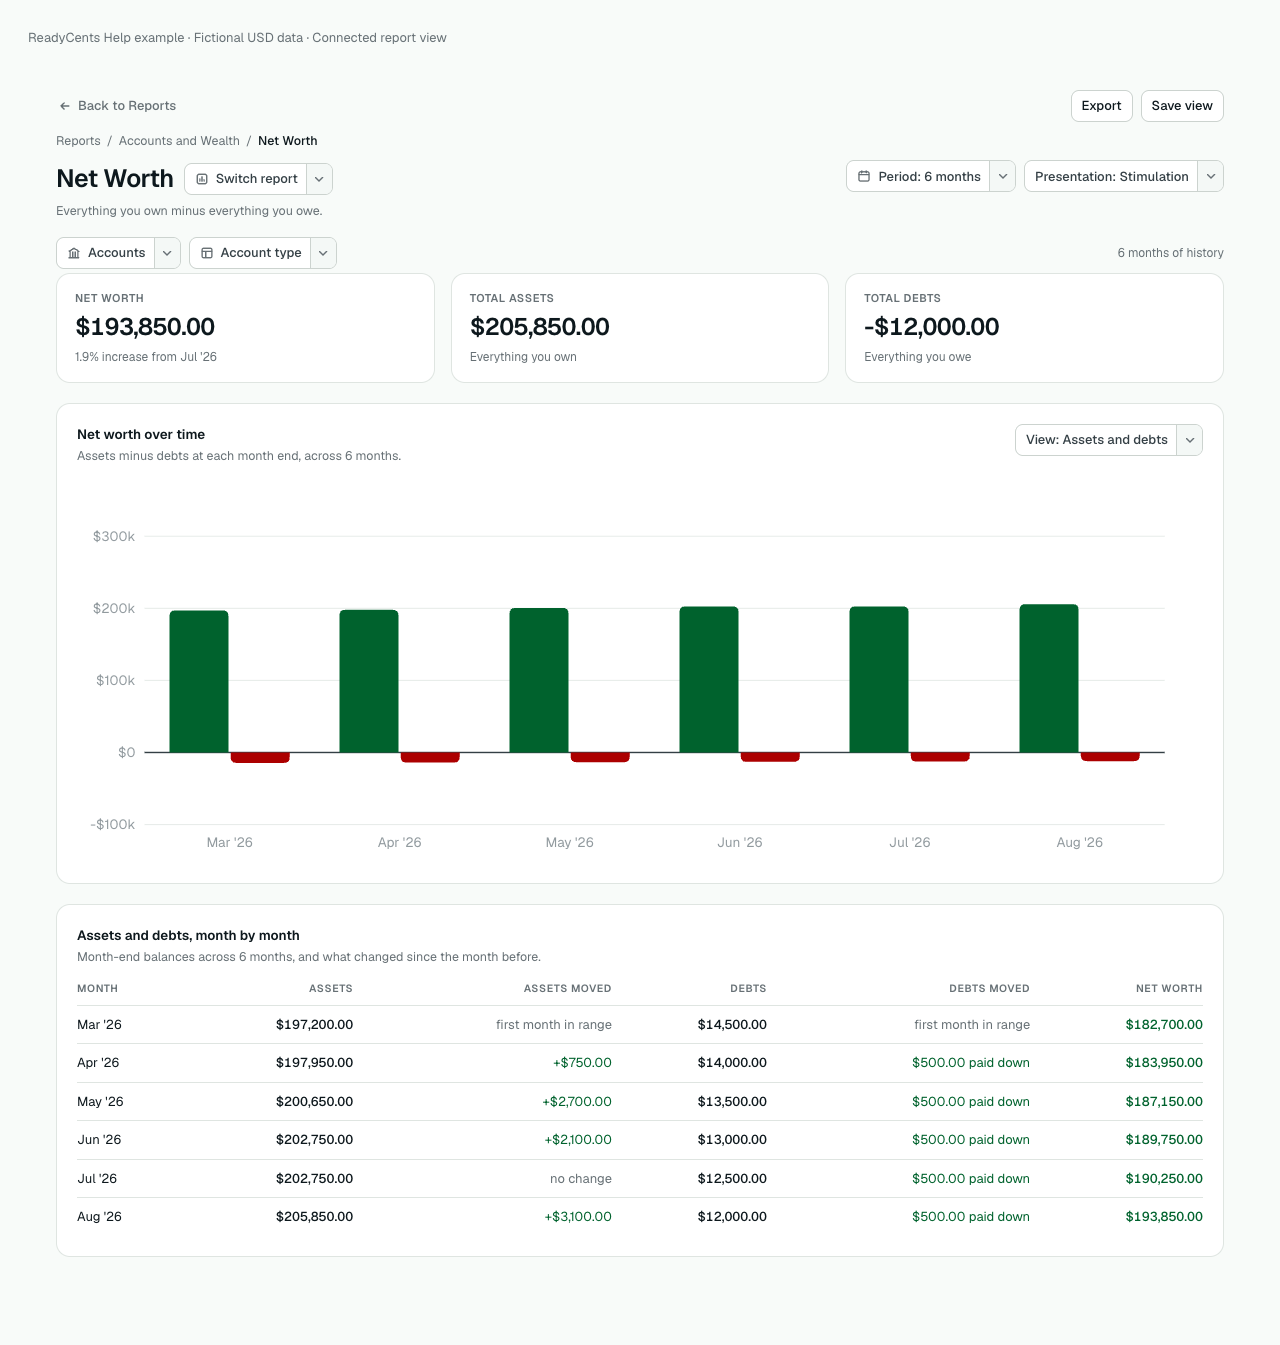
Here is a fictional budget with checking, emergency savings, retirement savings, a car asset, and a car loan. In August, $205,850 in assets minus $12,000 in debts equals $193,850 net worth. The report shows debt as negative in the summary and as the amount owed in the detail table.
The trend chart
Open Reports → Net Worth and choose the period you want to explore. The chart shows month-end snapshots from recorded account history. Use View to switch between Bar, Line, Spline, Area, Assets and debts, or Table. Changing the view does not change your balances.
Line helps you follow the overall direction; Assets and debts separates what you own from what you owe. Hover or keyboard-focus an available chart item to inspect its value. For a comparison using the same fictional accounts, open the line-chart example at full size.
Read the monthly detail
The table below the chart shows each month's assets, debts, net worth, and changes from the preceding month. A first-month comparison is labeled first month in range, not treated as zero movement.
In this example, July ends at $190,250. During August, assets rise by $3,100 and the debt balance falls by $500. Together, those changes increase net worth by $3,600, bringing August to $193,850.
That increase is not all income. In the fictional records, August has $1,800 net income and a $1,800 investment-value increase. The $500 loan-principal payment reduces both cash and debt, so it does not create another $500 of wealth on its own.
Check the scope and take the detail with you
- Check Accounts and Account type. The summary, chart, and table use the same selected account set.
- Compare the monthly detail with the underlying account records. Missing transactions, stale asset values, and incorrect balances can all affect the trend.
- Use Export for the current view's CSV, including monthly assets, debts, movements, and net worth. Use Save view to keep a useful report setup.
