
The short version
- Choose a report, then check its period and filters before comparing the figures.
- Use the chart's View control to change the visualization. Hover or focus a chart item for its breakdown.
- Saved Views remember a report setup. Your Charts builds a named chart from supported report options.
- Connected Basic and Connected Premium include the same reports. Their bank connection options differ.
Start with a question
- Open Reports and choose a topic. Spending Breakdown answers where spending went; Income vs. Expense compares income and spending.
- Choose the period or range. Use the available account, envelope, payee, or other filters to narrow the question.
- Read the totals together with the chart and detail table. A filtered result describes that selection, not necessarily your entire budget.
- Use Switch report to explore another report, or Back to Reports to return to the overview.
Example: your month at a glance
This fictional August budget received $7,200 and spent $5,400, leaving $1,800 net income. That is a 25% savings rate for the selected month. Its $193,850 net worth is a different measure: the value of its assets minus its debts, not just this month's income.
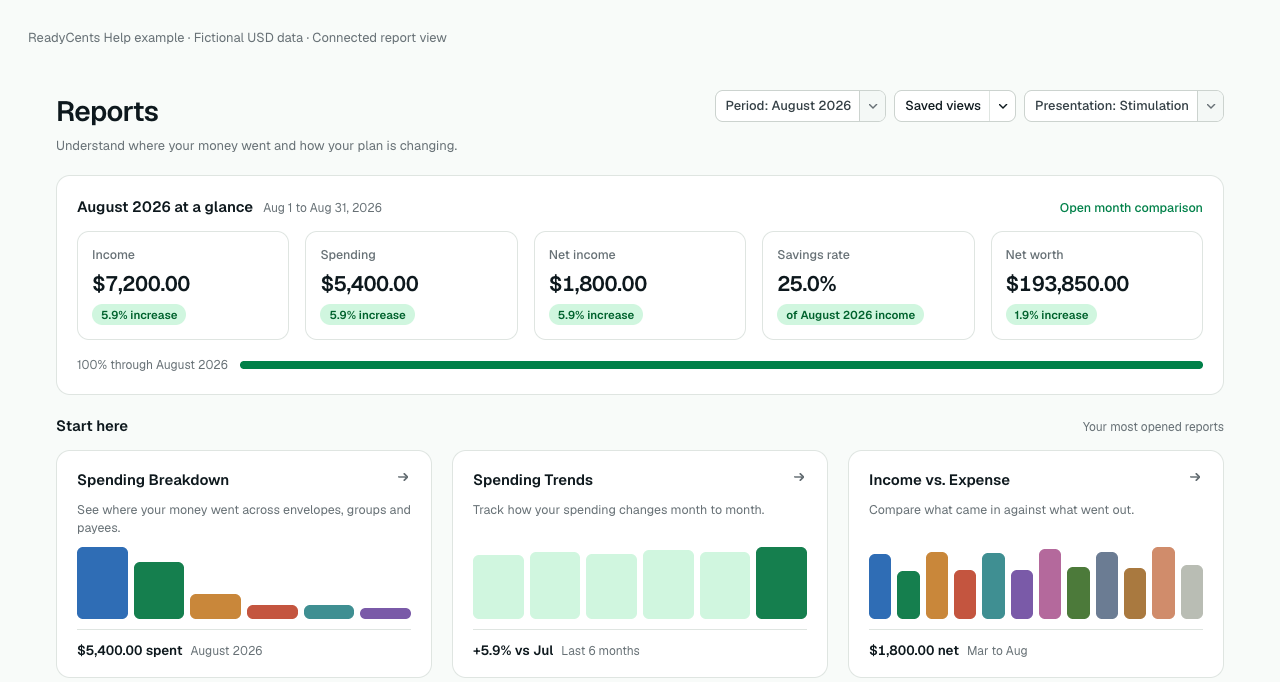
Start here gives you a visual entry into the detail reports. Compare which envelopes received the most spending, how spending changed over six months, and how income compares with expenses. Then open a report to inspect its figures and filters.
Follow the same example into the Net Worth guide to see the assets, debts, and monthly changes behind the total.
Choose a chart and inspect its details
The View menu offers the chart types supported by that report. Spending Breakdown includes donut, pie, horizontal bar, treemap, and table views. Spending Trends shows changes across months.
Hover a chart item with a pointer, or use Tab to focus an available chart item with the keyboard. The inspector explains the selected value and its context. Escape dismisses it. A table view is available in supported reports when you prefer reading rows to a chart.
Cash Flow includes a Sankey option. Its connecting bands show how money flows through the selected scope. Kept in accounts and From existing balance explain the difference between inflow and outflow; they are not extra transactions.
Saved Views, Your Charts, and exports
Use Save view to name a useful report setup, then reopen it from Saved Views. Your Charts is a separate builder on Reports home: choose a supported report, measure, grouping, chart type, and range. Opening a saved chart applies its definition to its report.
Report filters, Saved Views, chart definitions, chart type, and presentation preferences synchronize through your account. Workspace-specific choices stay with their workspace. This does not publish a preset to other household members.
Use Export for a report's CSV. Check the selected period and filters before exporting, and treat the downloaded file as financial information. Saving a view or exporting a report does not change your transactions.
Presentation and patterns
Minimalism reduces supporting visual detail. Stimulation shows more context. Switching presentation does not change the calculation or your underlying records.
On Reports home, Patterns and goals switches between Savings Goal Tracker and Spending Heatmap. The heatmap shows daily spending for a month. No spending and no recorded data are different states, not interchangeable zeroes.
What comes with your plan
Free includes Spending Breakdown with its Free dimensions, Net Worth without a new history cap, Income vs. Expense with monthly comparison, and basic Debt Progress. Savings Goal Tracker and Saved Views remain available on Free.
Connected Basic and Connected Premium include Spending Trends, Top Envelopes, Payees & Merchants, Cash Flow, Income Sources, and Savings Rate, along with Spending Heatmap and Your Charts. Some enhancements within otherwise Free reports require Connected.
A locked preview explains a paid feature. An unfinished report is different: buying a plan does not make an unbuilt report available. The catalogue also includes planned destinations. For existing tax tools, see Tax Tracking; report names alone do not imply a finished tax report or tax-filing service.
Understanding the numbers
Why a report may differ from an account balance
A balance is what an account holds or owes at a point in time. Income and spending describe eligible activity over a period. Transfers, scheduled activity, adjustments, refunds, and reimbursements do not all have the same reporting treatment.
Check the report's selected accounts, date range, and explanation before comparing it with another page. Net Worth and Debt Progress can use different account scopes. Income Sources groups eligible income by payee; income without a payee appears under No source recorded.
Missing comparisons and savings rates
Not comparable means there is not an appropriate prior-period comparison. It is not a zero-percent change. Comparisons must describe compatible periods, including partial months.
Savings Rate explains its income denominator and spending calculation. A month with no income has no defined rate and shows Not available rather than 0%. Refunds are shown separately instead of silently being treated as new income.
When filters leave an empty result
Check every active filter. In Net Worth and Debt Progress, selecting several account types widens that filter, while selecting a named account and a type applies both. A named debt account combined with Cash can therefore match nothing.
The report keeps your choices visible. Clear or change a filter to broaden the selection. If a saved filter or chart type no longer applies, read the notice rather than assuming the saved view still answers the same question.
